100% Practical, Personalized, Classroom Training and Assured Job Book Free Demo Now
- Classroom Training
App Development
Digital Marketing
Other
- English Speaking Course
- Diploma Courses
- Computer Courses
- Mechanical
- Electrical
- Online Bidding
Programming Courses
Professional COurses
- Our Branches
- Our Services
- Student Zone
- Blogs
- More
Introduction
Data analysis is the process of examining data in order to identify trends and draw conclusions about the information it contains. Data analysis is done by specialized systems and software and is widely used across industries. It enables organizations to analyze the market’s needs and make more-informed business decisions. It is also widely used for research purposes to verify or disprove theories, hypotheses, and various scientific models.
Types of Data Analytics
Data analytics is a broad field but we can categorize Data Analytics into four major categories: descriptive, predictive, diagnostic, and prescriptive analysis. These are also the primary applications of data analytics in business.
- Descriptive analysis: Descriptive Analysis helps to describe, show or summarize data in a way such that patterns might emerge which helps to describe outcomes to stakeholders. The process requires the collection, processing of the relevant data, data analysis, and visualization. This process can provide essential insight into past performances.
 
- Predictive analysis: Predictive analysis answers questions about what will happen in the future. This Analytical technique uses historical data to identify trends, real-time insights and to predict future events. The technique includes a variety of statistical and machine learning applications, such as neural networks, regression, and decision trees.
¬† - Diagnostic analysis:¬†¬†Diagnostic analysis examines data to answer questions about ‚Äúwhy did it happen?‚ÄĚ. These techniques take the findings from descriptive analysis and dig deeper to find the cause. The technique includes drill-down, data mining, data discovery, and correlations. This is a three steps operation:
- Identification of anomaly.
- Data related to these anomalies is collected.
- Use of Statistical techniques to find trends that explain these anomalies.
 
- Prescriptive analysis:¬†Perspective analysis examines the data to answer questions about ‚Äúwhat should be done?‚ÄĚ. It uses insights from predictive analysis for data-driven decisions making. This technique depends on machine learning strategies to find patterns in large datasets and to analyze past events so that the likelihood of different outcomes can be estimated.
Each type is employed for a different goal and at a different place in the data analysis process. 
Role of a Data Analyst
A data analyst uses programming skills to analyze and fetch relevant information out of large amounts of complex data. Basically, an Analyst derives meaning from messy data. A Data analyst needs to have the following skills:
 
- Programming skills: Sound knowledge of programming is required for analyzing Data in SQL, R, Python, etc. While working in python, one must be aware of the right libraries that can be used to get results efficiently.
  - Statistics: Statistical knowledge is very helpful to derive meaning from data.
  - Machine learning: With help of machine learning algorithms we can find structure in data which is helpful in drawing insights and deriving meaningful conclusions.
 
- Data Visualization: A Data analyst must have great data visualization skills, in order to summarize and present data.
  - Presentation skills: An analyst needs to communicate their observations to a stakeholder. They need to link all relevant observations and meaningfully present it to the client.
 
- Critical thinking: It’s required to analyze structure and linkages within a Data set. Moreover, it’s necessary for interpreting data and drawing conclusions.
 
The work of a data analyst involves working with data throughout the data analysis pipeline. The primary steps in data analysis are data mining, data management, statistical analysis, and data presentation.
 
- Data mining involves the extraction of data from unstructured data sources which may include written text, complex databases, raw data. Extract, Transform, Load (called ETL) converts raw data into a useful and manageable format. Data mining is usually the most time-consuming step in the data analysis pipeline.
 
- Data Management or warehousing is another important part of a Data Analyst’s job which involves designing databases that allow easy access to the results of data mining.
 
- Both Statistical and machine learning techniques are used by analysts to reveal trends and draw insights from the data. The model prepared, can be applied to new data to make predictions for informed decision making. Statistical programming languages like R or Python (pandas) are necessary for this process.
  - Mostly the final step in data analysis is the presentation, where the insights are shared with the stakeholders. The use of Data Visualization tools is highly recommended as compelling visuals can help in showing the correlations in data and help listeners understand the importance of insights.
Data Analysis using Python
Below, I am going to walk you through some libraries in python which are very helpful for Data Analysis.
 
Numpy & Pandas are your two evergreen friends on this journey. Both of these libraries are extremely important and the logic developed while studying these two libraries is also helpful in various other languages like SQL.
 
- Numpy: Numpy is a widely-used Python library.¬†By using NumPy, you can speed up your tasks and interface with other packages present in the Python ecosystem, like scikit-learn, which uses NumPy under the hood. Almost every data analysis or machine learning package for Python leverages NumPy in some way.¬†You may want to have a look at Numpy’s official website to explore some interesting stuff going on with¬†Numpy!
  - Pandas: Pandas might be lazy animals. But Pandas in python is one of the most actively used libraries. It provides extended data structures to hold different types of data. Pandas make Data analysis in python very flexible by providing functions for operations like merging, joining, reshaping, concatenating data, etc. You may want to have a look at Pandas’s official website to explore some interesting stuff going on with Pandas!
Below is an example to walk you through the simple application of these libraries :
 
import pandas as pd
import numpy as np

x1 = np.array(['a', 'a', 'b', 'b', 'b'])
x2=np.array([50, 250, 100, 400, 350])
x3=np.array([10, 20, 20, 50, 40])
x4=np.array([2, 3, 1, 4, 3])
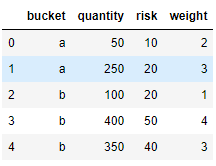
df1 = pd.DataFrame({'bucket':x1,'quantity':x2, 'risk':x3, 'weight':x4})
df1
Output:

 
We have a simple table with 4 columns (one nominal and three numerical)
 
Let’s try to solve below mentioned problems:
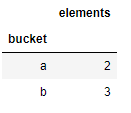
- The number of elements as a new col ‘elements’.
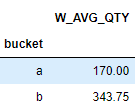
- The weighted average of qty and risk, as columns Wtd_AVG_QTY and Wtd_AVG_RISK. 
 
df1.groupby('bucket').agg({'bucket': len}).rename(columns={'bucket': 'elements'})
 
df1.groupby('bucket').apply(lambda g: np.average( g.quantity, weights=g.weight)).to_frame('W_AVG_QTY')
This can also be done by sum(weight*quantity)/ sum(weight).
 
EXPLORING DATA
Moving ahead, we’ll learn how to gather data, visualize it, and make sense out of it.
- Matplotlib: Matplotlib is the most popular plotting python library. It‚Äôs an amazing visualization library in python for 2D plots of arrays.¬†Matplotlib is a viable open-source alternative to MATLAB. Developers can also use matplotlib‚Äôs APIs to embed plots in GUI applications.¬†You may want to have a look at Matplotlib’s official website to explore some interesting stuff going on with¬†Matplotlib!
¬† - Seaborn: This is another plotting library built on top matplotlib and is more versatile.It provides a high-level interface for drawing attractive and informative statistical graphics.¬†You may want to have a look at¬†Seaborn’s official website to explore some interesting stuff going on with¬†Seaborn!

